Appendix 1. About educational databases
All exercises are performed on the databases described below.
1. Computer firm
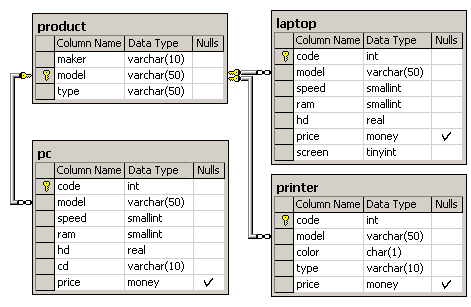
The database scheme consists of four tables:Product(maker, model, type)
PC(code, model, speed, ram, hd, cd, price)
Laptop(code, model, speed, ram, hd, screen, price)
Printer(code, model, color, type, price)
The Product table contains data on the maker, model number, and type of product ('PC', 'Laptop', or 'Printer'). It is assumed that model numbers in the Product table are unique for all makers and product types. Each personal computer in the PC table is unambiguously identified by a unique code, and is additionally characterized by its model (foreign key referring to the Product table), processor speed (in MHz) – speed field, RAM capacity (in Mb) - ram, hard disk drive capacity (in Gb) – hd, CD-ROM speed (e.g, '4x') - cd, and its price. The Laptop table is similar to the PC table, except that instead of the CD-ROM speed, it contains the screen size (in inches) – screen. For each printer model in the Printer table, its output type (‘y’ for color and ‘n’ for monochrome) – color field, printing technology ('Laser', 'Jet', or 'Matrix') – type, and price are specified.
2. Recycling firm
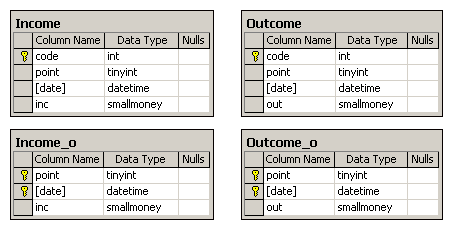
The firm owns several buy-back centers for collection of recyclable materials. Each of them receives funds to be paid to the recyclables suppliers. Data on funds received is recorded in the tableIncome_o(point, date, inc)
The primary key is (point, date), where point holds the identifier of the buy-back center, and date corresponds to the calendar date the funds were received. The date column doesn’t include the time part, thus, money (inc) arrives no more than once a day for each center. Information on payments to the recyclables suppliers is held in the table
Outcome_o(point, date, out)
In this table, the primary key (point, date) ensures each buy-back center reports about payments (out) no more than once a day, too.
For the case income and expenditure may occur more than once a day, another database schema with tables having a primary key consisting of the single column code is used:
Income(code, point, date, inc)
Outcome(code, point, date, out)
Here, the date column doesn’t include the time part, either.
3. Ships
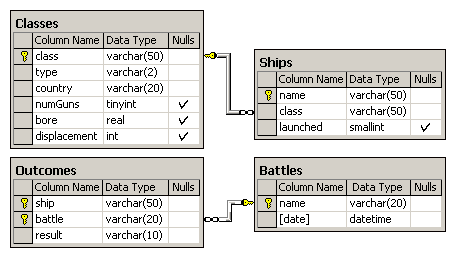
The database of naval ships that took part in World War II is under consideration. The database consists of the following relations:Classes(class, type, country, numGuns, bore, displacement)
Ships(name, class, launched)
Battles(name, date)
Outcomes(ship, battle, result)
Ships in classes all have the same general design. A class is normally assigned either the name of the first ship built according to the corresponding design, or a name that is different from any ship name in the database. The ship whose name is assigned to a class is called a lead ship.
The Classes relation includes the name of the class, type (can be either bb for a battle ship, or bc for a battle cruiser), country the ship was built in, the number of main guns, gun caliber (bore diameter in inches), and displacement (weight in tons). The Ships relation holds information about the ship name, the name of its corresponding class, and the year the ship was launched. The Battles relation contains names and dates of battles the ships participated in, and the Outcomes relation - the battle result for a given ship (may be sunk, damaged, or OK, the last value meaning the ship survived the battle unharmed).
Notes: 1) The Outcomes relation may contain ships not present in the Ships relation. 2) A ship sunk can’t participate in later battles. 3) For historical reasons, lead ships are referred to as head ships in many exercises.4) A ship found in the Outcomes table but not in the Ships table is still considered in the database. This is true even if it is sunk.
4. Airport
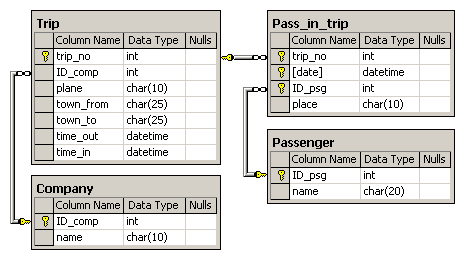
The database schema consists of 4 tables:Company(ID_comp, name)
Trip(trip_no, id_comp, plane, town_from, town_to, time_out, time_in)
Passenger(ID_psg, name)
Pass_in_trip(trip_no, date, ID_psg, place)
The Company table contains IDs and names of the airlines transporting passengers. The Trip table contains information on the schedule of flights: trip (flight) number, company (airline) ID, plane type, departure city, destination city, departure time, and arrival time. The Passenger table holds IDs and names of the passengers. The Pass_in_trip table contains data on flight bookings: trip number, departure date (day), passenger ID and her seat (place) designation during the flight. It should be noted that
- scheduled flights are operated daily; the duration of any flight is less than 24 hours; town_from <> town_to;
- all time and date values are assumed to belong to the same time zone;
- departure and arrival times are specified with one minute precision;
- there can be several passengers bearing the same first name and surname (for example, Bruce Willis);
- the seat (place) designation consists of a number followed by a letter; the number stands for the row, while the letter (a – d) defines the seat position in the grid (from left to right, in alphabetical order;
- connections and constraints are shown in the database schema below.
5. Painting
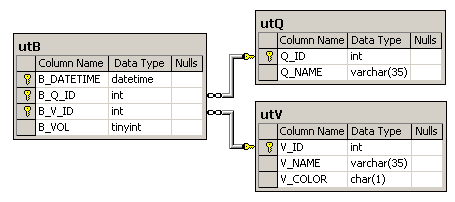
The database schema consists of 3 tables:utQ (Q_ID int, Q_NAME varchar(35)), utV (V_ID int, V_NAME varchar(35), V_COLOR char(1)), utB (B_DATETIME datetime, B_Q_ID int, B_V_ID int, B_VOL tinyint).
The utQ table contains the identifiers and names of squares, the initial color of which is black. (Note: black is not a color and is considered unpainted. Only Red, Green and Blue are colors.)
The utV table contains the identifiers and names of spray cans and the color of paint they are filled with.
The utB table holds information on squares being spray-painted, and contains the time of the painting event, the square and spray can identifiers, the quantity of paint being applied.
It should be noted that
- a spray can may contain paint of one of three colors: red (V_COLOR='R'), green (V_COLOR='G'), or blue (V_COLOR='B');
- any spray can initially contains 255 units of paint;
- the square color is defined in accordance with the RGB model, i.e. R=0, G=0, B=0 is black, whereas R=255, G=255, B=255 is white;
- any record in the utB table decreases the paint quantity in the corresponding spray can by B_VOL and accordingly increases the amount of paint applied to the square by the same value;
- B_VOL must be greater than 0 and less or equal to 255;
- the paint quantity of a single color applied to one square can’t exceed 255, and there can’t be a less than zero amount of paint in a spray can;
- the time of the painting event (B_DATETIME) is specified with one second precision, i.e. it does not contain milliseconds;
- for historical reasons, the spray cans are referred to as “balloons” by many of the exercises, and the utV table contains spray can names (V_NAME column) such as “Balloon # 01”, etc.
6. Football (soccer) club
National Football Championship. Information on a single season of one team. Each game lasts exactly 90 minutes.Tables
Players: Players (player_id, first_name, last_name, nickname, citizenship, dob, role)
player_id - uniform number, nickname - name on the uniform, citizenship (NULL for native players), dob - date of birth, role - position;
Games: Games(game_id, team, city, goals, game_date, own)
game_id - matchday number, team - opposing team, city - city where the match took place (NULL if it was a home game), goals - goals scored by the opponent, including own goals shot by own players (NULL if not scored), game_date - match date/time, own - own goals by opposing team (null if there were none);
Participation in games: Lineups (start, game_id, player_id, time_in, goals, cards)
start - 'B' - the player was in the starting lineup, 'S' - he started the match on the bench; time_in - playing time in minutes (NULL if the player did not enter the game); goals - the number of goals the player scored in the match (NULL if he didn't score any goals); cards – penalty cards: 'Y' (yellow), 'Y2' (two yellow cards), 'R' (direct red), 'YR' (yellow+direct red), NULL (no cards shown).

Appendix 2. The list of exercises (SELECT)
Below is the list of all the first-phase rating exercises which are optional with respect to certification and advance over stages.
The number of each exercise, the database number for the corresponding exercise, and the exercise complexity level are given in the list.
| no. | DB | level | exercise |
| -1 | 5 | 1 | With the least-square method, calculate the linear dependence of paint expenses on time: V = at + b, where V - paint supply; t - time in seconds, counted from the first painting (t = 0). Result set: a with 8 digits that can be placed to the right of the decimal point; b with 2 digits that can be placed to the right of the decimal point. |
| -2 | 3 | 2 | For each country, find the year, in which the maximal number of ships had been launched. In the case of more than one year in question, take a minimal year. Result set: country, number of ships, year |
| -3 | 5 | 2 | There are torussians of three colors (red, green, blue) who live in the Torus 6x4 planet. The first 24 squares of utQ table (ordered by B_Q_ID) - the countries of the planet. T00 - first square T03 - square number four T10 - square number five T53 - square number twenty four Amount of the paint on a square - the amount of torussians of each color(R, G, B) On the Merkadot's birthday all torussians in each country split groups - 8 groups of each color; The amount of torussians in each group equals R/8, G/8, B/8. All the groups are sent to the 8 neighboring countries (by one group of each color in each neighboring country). The rest of the torussians are staying at home (R%8, G%8, B%8 respectively) Find the amount torussians of each color in every country on this significant day Output: amount of torussians of each color on the Mercadot's map for country "T00" using the format: "Txy - cccR cccG cccB" where Txy - country name, ccc - the amount with leading zeroes. |
| -4 | 5 | 2 | Find the squares with the time interval between first and finish paintings greater than average time interval for painted squares. Result set: square name, maximal time between its sequential paintings in seconds. |
| -5 | 3 | 1 | The Battles table contains not only major battles with the participation of many ships but also records, starting with symbol # and containing data about minor sea conflicts. Related conflicts combined in a groups from 1 to 6 items. Name format of such records is as follows: - # followed by group code (does not contain digits, may be missing) - continues with group registration number (integer, is required) - continues with additional conflict number inside of group. It could be arabian or roman numerals, letters of Latin with different separators, for example a,b,c... /1,/2,/3... .1,.2,.3... i,ii,iii... etc., but the same for a whole group and with no gaps. The first or only conflict in a group may not have such additional number. Get list of conflicts records, sorted by group code, group number, additional number. Result set: The name of conflict, the number by order (starting with 1) |
| -6 | 4 | 2 | One second of a flight of each passenger gives 1 cent ($0.01) profit to airline company. Taking this fact into account, perform ABC analysis of passengers attractiveness (an airline company does not matter). ABC analysis is based on Pareto principle - 80% of your sales come from 20% of your clients. After the analysis, passengers should be grouped into 3 categories: A, B, and C. The algorithm: 1. Calculate ratio of each passenger's profit contribution with running totals (S) to total profit from all passengers (TS). Contribution with running totals for each passenger is calculated by summation of his profit with profits from all those passengers that give larger or equal profits. In the case of equal profits, the smaller running totals will be for the passenger, name of which goes earlier in alphabetic order. 2. Group the passengers over ABC categories. Category "A" - passengers with S/TS between 0.00% and 80.00% (inclusive). Category "B" - S/TS from 80.01% up to 95.00%. Category "C" - S/TS from 95.01% up to 100%. Result set: Passenger's name, sum of profit from this passenger ($), S/TS of the passenger in percent (accuracy within 0.01), ABC category of the passenger. |
| -7 | 1 | 1 | In Product table, find out the models the first symbol of which represents an even digit, and the last one - odd digit. The first symbol should also be less than the last one. Result set: model, type of model, product of first and last digits in model's No. |
| -8 | 2 | 2 | A scrap recycling company is examining status of their outlets. Assuming each outlet starts with $10000 dollars find the date which is was profitable, in case the outlet is not profitable, write the last date an income was recorded. To determine the profit of a company we will look at the Outcome_o only and not look at either incomes tables or the the outcome table. Result set: Outlet ID (point), profitable date (or last working day), profit (or remaining to be profit). |
| -9 | 3 | 1 | A ship can be mentioned more than once in the Outcomes table if it took part in more than one battle. It's needed to find out ship names which differ by only case of characters, say, "Duke of York" and "duke Of york". Result set: ship's name (any variant of writing), number of different writing variants that could be used for this ship in the table. |
| -10 | 4 | 1 | Display flights map on Google Static Maps. SHow only unique directions so that name of the first city is earlier than second city’s name in alphabetic order. For example, if there is a flight from Rome to Berlin, but there is no one from Berlin to Rome, you need to show a direction Berlin-Rome. Or if there are both flights, from Milan to Madrid and from Madrid to Milan, you need to show only one direction Madrid-Milan. Output resulting directions in alphabetical order of their cities. For each city display a marker with first letter of city’s name. Resulting string should be like this (without line breaks): <img src="http://maps.googleapis.com/maps/api/staticmap ?path=weight:3|Aaa|Bbb &path=weight:3|Aaa|Ccc &path=weight:3|Bbb|Ccc &markers=label:A|Aaa &markers=label:B|Bbb &markers=label:C|Ccc &size=512x512&sensor=false"> , where <img src="http://maps.googleapis.com/maps/api/staticmap - directive to use Google Static Maps; ?path=weight:3|Aaa|Bbb - first direction, from city Aaa to city Bbb with line thickness 3; &path=weight:3|... - all other directions; &markers=label:A|Aaa - marker (A) of city Aaa; &size=512x512 - indication of size of the map 512x512; &sensor=false"> - required parameter. |
| -11 | 3 | 1 | Provide each ship's name from Ships table in base64 (wikipedia). Output: name, base64name. |
| -12 | 4 | 1 | At the airport, mathematician Ivanov has been calculating the factorial of the trip number for fun. For each trip, compute the number of trailing zeros in the result obtained by Ivanov. Note: the trip number cannot contain more than 4 digits. Output: trip_no, quantity of trailing zeros. |
| -13 | 4 | 1 | Find number of passengers for each day in the first half of the year 2003 from the date of a first trip up to the date of a last trip in this half of a year. First half of a year is the interval from 03.01.01 to 03.06.30. Result set: date, number of passenger |
| -14 | 3 | 1 | Determine the names of only those classes, which include only the ships with names consisting of only the characters used in the name of some class. Note. Case of characters does not matter. |
| -15 | 5 | 2 | Round parasols are installed in the coordinates of B_Q_ID, B_V_ID (utB table) on a flat sandy beach. Radius of each parasol equals B_VOL. Parasols are parallel to the sand. The sun is at its zenith. Each value of B_DATETIME corresponds to a separate task. Find out the area of shadow for each B_DATETIME value. Output: B_DATETIME; the area of shadow rounded to the nearest integer. |
| -16 | 2 | 1 | Determine such outlets (points) which have in Outcome table the records corresponding to every working day within some week (from Monday till Friday, without taking holidays into account). Deduce: point, date of Monday of full working week in the format "YYYY-MM-DD", total value of `out` for this week. |
| -17 | 4 | 1 | Concatenate the trip numbers sorted in ascending order into a single string. Starting from the left, break up the resulting string into substrings consisting of three characters each; leftover symbols are discarded. Treating each substring as a number, get their sum, as well as the minimum and maximum numbers. Result set: minimum number, maximum number, sum. |
| -18 | 2 | 2 | The Income and Income_o tables are considered, with records in them corresponding to the same set of buy-back centers. Each center is deemed to have been working on all dates occurring in the aforementioned tables, no matter to which centers they are corresponding, that lie within the time period between the first and the last date this center received funds. For each center having the highest average cash receipts per working day, determine the date(s) it received the largest sum of money. For these dates, display ALL information present in the tables, namely point, date, inc, code (or NULL if the entry belongs to Income_o). |
| -19 | 8 | 2 | At the press conference on the occasion of the season start, the manager claimed his team was going to play the 4-4-2 formation (4 defenders, 4 midfielders, 2 forwards). Assuming the club indeed was using this formation throughout the championship, find out, for each game, the minimum possible number of starters not playing their assigned positions (Nfp). Result set: matchday number; opposing team; "home" for a home game, "away" for a game played on the road; result ("win" if the considered team won, "loss" if the opposing team won, "draw" if there was a tie); Nfp. |